A clean, modern Excel dashboard designed to give you instant visibility into your marketing results across four key channels. Track Sessions, Leads, Conversions, Spend, Revenue, and ROI — all in one lightweight, formula-only dashboard.
Marketing teams need fast, reliable insights without the complexity of advanced analytics tools. The Marketing Performance Mini Dashboard gives you a crystal-clear view of how your marketing channels are performing each month — all inside Excel.
This dashboard combines KPI cards, per-channel performance summaries, and professionally designed charts to help you answer essential questions:
- Which channels are driving the most traffic?
- Are we generating enough leads from our spend?
- Which channel has the best conversion rate?
- What’s our overall ROAS (Return on Ad Spend)?
- Is performance improving month over month?
Paste in your data, and the entire dashboard updates instantly. No macros. No Power Query. No setup.
Who This Dashboard Is For
- Marketing managers
- Small business owners
- Agencies and freelancers
- Growth & performance marketers
- Social media managers
- Anyone tracking multi-channel marketing KPIs in Excel
What’s Inside
Your download includes a fully automated Excel dashboard that visualizes your marketing results at a glance.
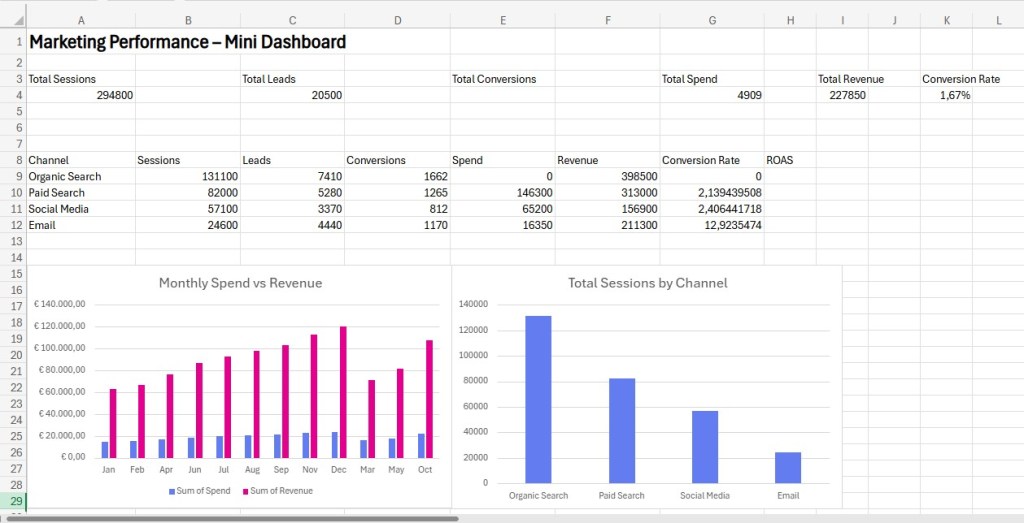
1. KPI Cards (Instant Overview)
At the top of the dashboard, six KPI cards give you the essential numbers:
- Total Sessions
- Total Leads
- Total Conversions
- Total Spend
- Total Revenue
- Conversion Rate (%)
Each KPI updates instantly when you replace the sample data.
Monthly Spend vs Revenue Chart
A clean, modern chart that highlights:
- Monthly ad spend
- Monthly revenue
- ROI patterns over time
- Seasonal performance trends
Great for presentations, dashboards, and weekly reporting meetings.
Channel Performance Summary
A compact but powerful table showing per-channel results:
- Sessions
- Leads
- Conversions
- Spend
- Revenue
- Conversion Rate (%)
- ROAS (Return on Ad Spend)
A quick visual way to identify your strongest and weakest channels.
4. Sessions by Channel Chart (Optional Section)
A simple but effective visual showing which channels are driving the most traffic.
Perfect for marketers presenting to non-technical stakeholders.
Key Features
- Built entirely with Excel formulas — no VBA, no macros
- Lightweight and fast, even on older machines
- Clean, minimalist design aligned with ExcelMiniDashboard.com’s visual style
- Fully editable (colors, fonts, chart style)
- Works with Excel 2021 and Excel for Microsoft 365
- Beginner-friendly but powerful enough for advanced users
- Instantly refreshes when you paste your real data
Pricing
€0 — Early Access Intro Price
(Price increases as more dashboards are added to the collection.)
Instant Download & Easy Setup
Download your file → Paste in your monthly marketing data → Present your insights in seconds.
No configuration. No setup. No complexity.
License
- Personal & commercial use permitted
- Redistribution, resale, or re-publishing the template is not allowed
