A clean, lightweight Excel dashboard that gives you instant visibility into stock levels, low-inventory risks, fast-moving items, and reorder priorities — all in one modern, formula-only template.
Inventory management does not have to be complicated. The Inventory Health Mini Dashboard delivers an at-a-glance overview of your stock status, helping you spot low-stock items, prevent stockouts, and identify fast movers — without relying on complex BI tools or heavy spreadsheets.
Built entirely with Excel formulas (no macros, no scripts, no Power Query), this dashboard updates instantly when you paste in your inventory data. It’s perfect for warehouse managers, e-commerce sellers, purchasing teams, and small businesses that want a professional inventory snapshot without the overhead of a full ERP system.
Who This Is For
- Warehouse & operations managers
- E-commerce sellers
- Retail store owners
- Purchasing & procurement teams
- Office administrators
- Anyone responsible for keeping inventory healthy and available
What’s Inside
This dashboard automatically highlights stock risks, fast sellers, and inventory trends with clean visuals and intuitive metrics.
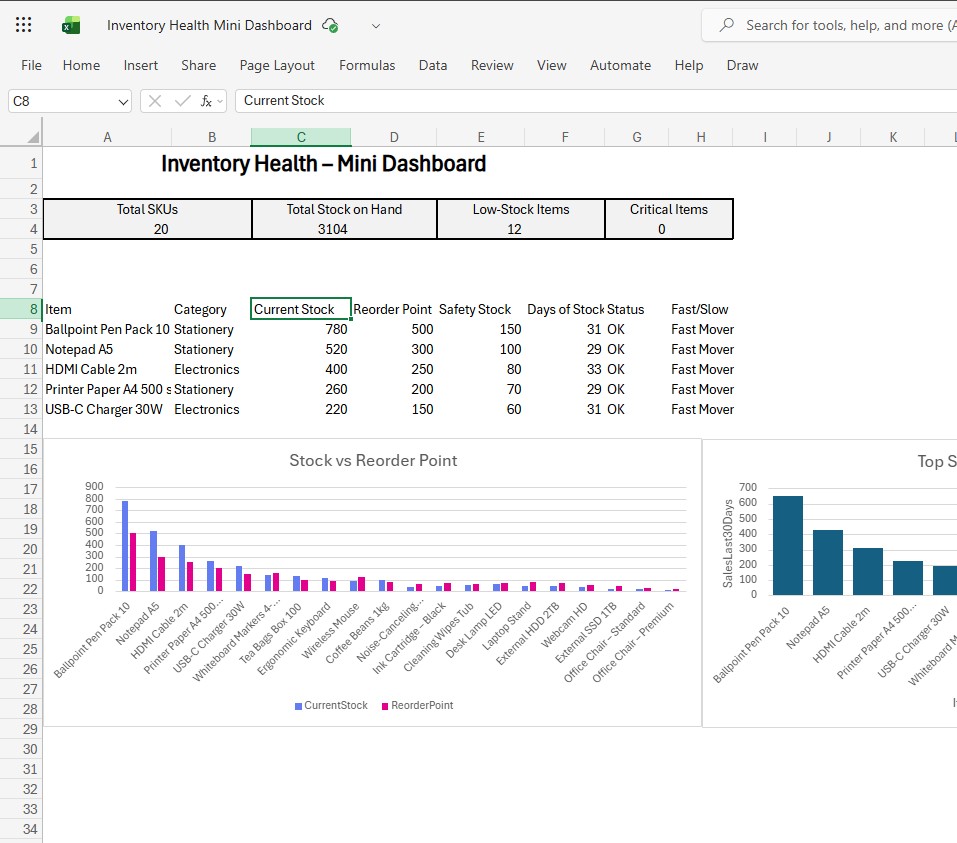
1. KPI Cards (Top-Level Inventory Overview)
Four modern KPI cards deliver your most important inventory metrics:
- Total SKUs
- Total Stock on Hand
- Low-Stock Items
- Critical Stock Items
These cards update instantly when you replace the sample dataset.
2. Inventory Health Summary Table
A clean, easy-to-scan table showing:
- Item name
- Category
- Current stock level
- Reorder point
- Safety stock
- Days of stock remaining
- Risk status (OK / Reorder / Critical)
- Fast vs Slow mover classification
Perfect for identifying which items need attention today.
3. Stock vs Reorder Point Chart
A visual comparison of Current Stock vs Reorder Point across all products — instantly revealing:
- Items approaching stockout
- Over-stocked items
- Products that need immediate replenishment
A practical aid for purchasing and supply chain decisions.
4. Fast Movers Chart (Sales Last 30 Days)
A chart highlighting your top-selling items based on 30-day activity.
Great for forecasting demand, planning procurement, and understanding product velocity.
Key Features
- 100% built with formulas (no VBA, no macros, no Power Query)
- Clean, modern layout consistent with ExcelMiniDashboard.com
- Lightweight and fast — perfect for everyday use
- Fully editable (add columns, rename items, change categories)
- Automatically highlights reorder risks and fast movers
- Works with Excel 2021 and Excel for Microsoft 365
- Includes synthetic sample data for testing
Pricing
€0 — Early Access Launch Price
(Limited time before this product joins the full dashboard collection.)
Instant Download & Easy Setup
Download → Paste in your stock data → Your dashboard updates automatically.
Designed for real businesses that want faster visibility without complexity.
License
- Personal and commercial business use allowed
- Redistribution, resale, or repackaging of the template is not permitted
