As analytics platforms become increasingly infused with AI, organizations face a subtle but critical tension: Should insights be designed for humans to read—or generated for machines to decide?
On one side are human-readable dashboards: carefully designed visual interfaces built around charts, KPIs, and narratives that people can interpret, debate, and act upon together. On the other are machine-generated insights: automated explanations, forecasts, anomaly detections, and recommendations produced by algorithms—often delivered as text summaries, alerts, or API outputs.
This is not a question of replacement. It is a question of balance.
The most effective analytics systems do not choose between dashboards and machine intelligence. They integrate both—using each where it is strongest, and deliberately managing the handoff between machine speed and human judgment.
This article explores the differences, strengths, and limitations of human-readable dashboards and machine-generated insights—and outlines how to design analytics systems that leverage both without losing clarity, trust, or control.

What Are Human-Readable Dashboards?
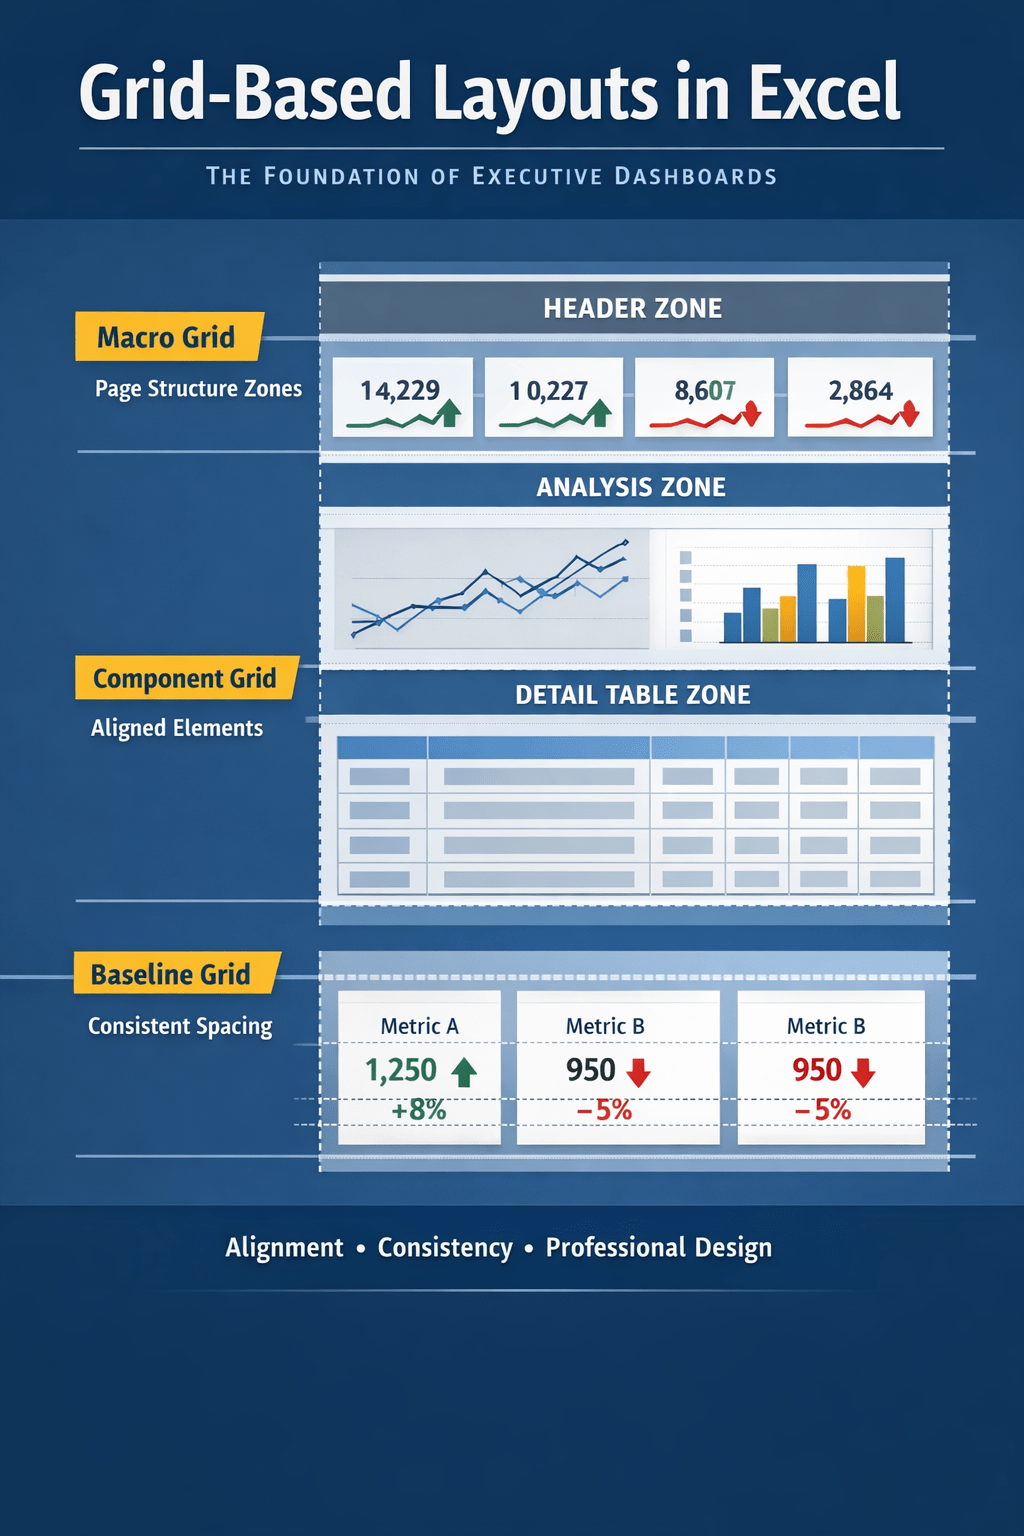
Human-readable dashboards are visual analytics interfaces optimized for interpretability, shared understanding, and decision alignment.
Their defining characteristics include:
- visual representations (charts, tables, KPI cards)
- stable metric definitions
- consistent layouts and timeframes
- contextual cues (targets, benchmarks, thresholds)
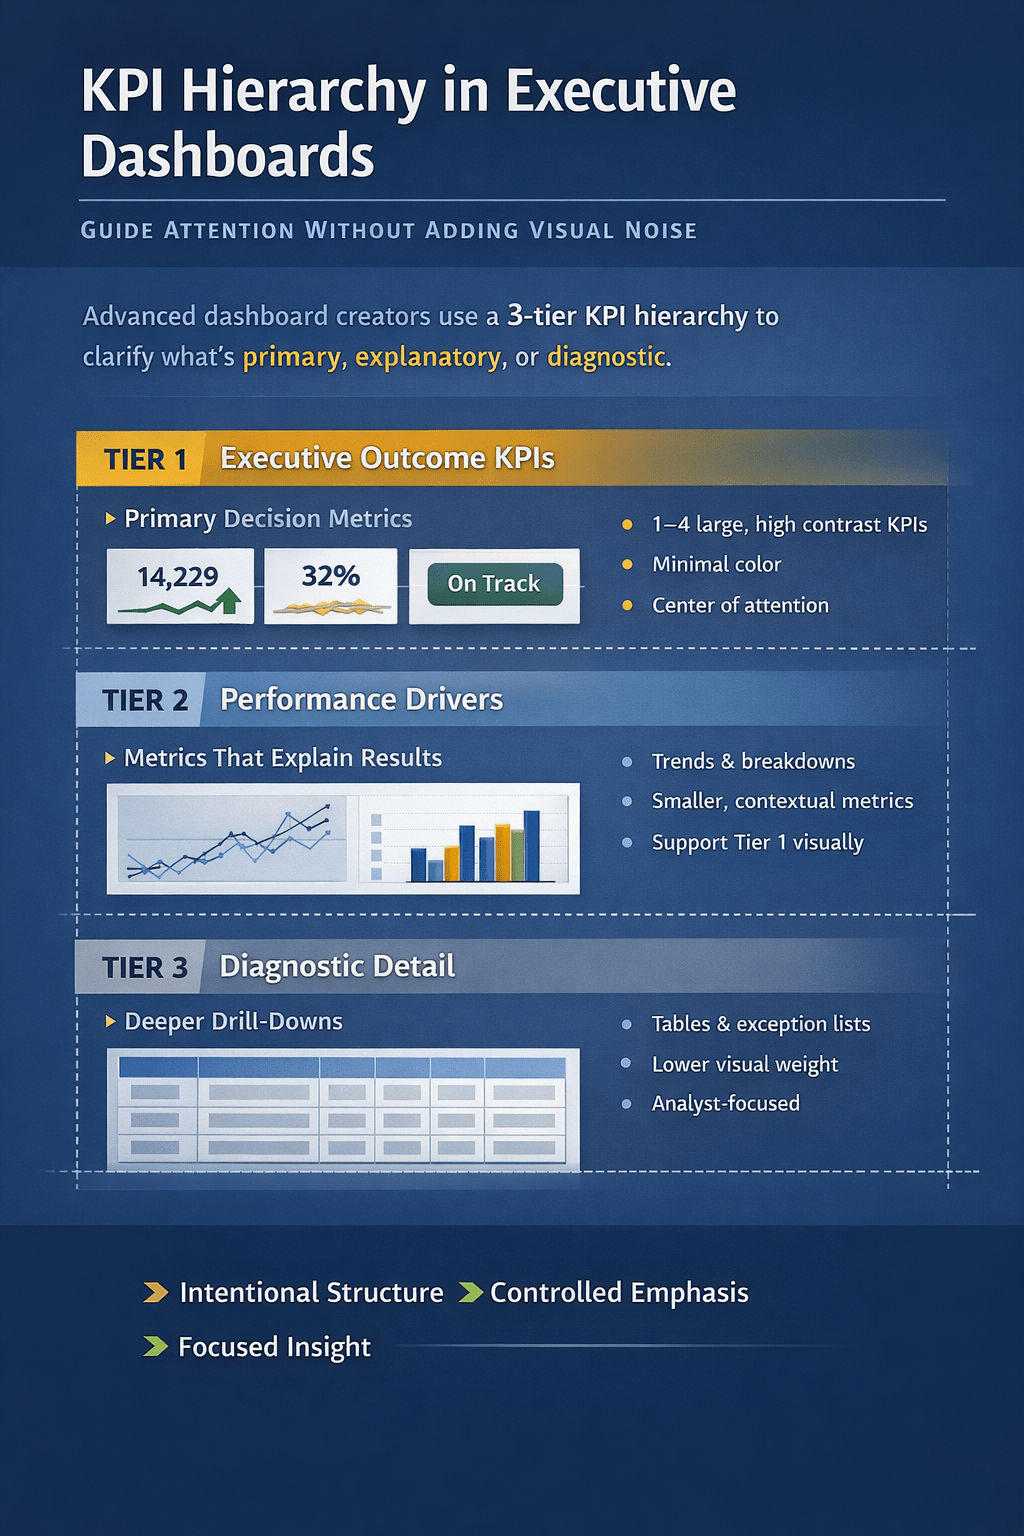
- intentional information hierarchy (what matters most first)
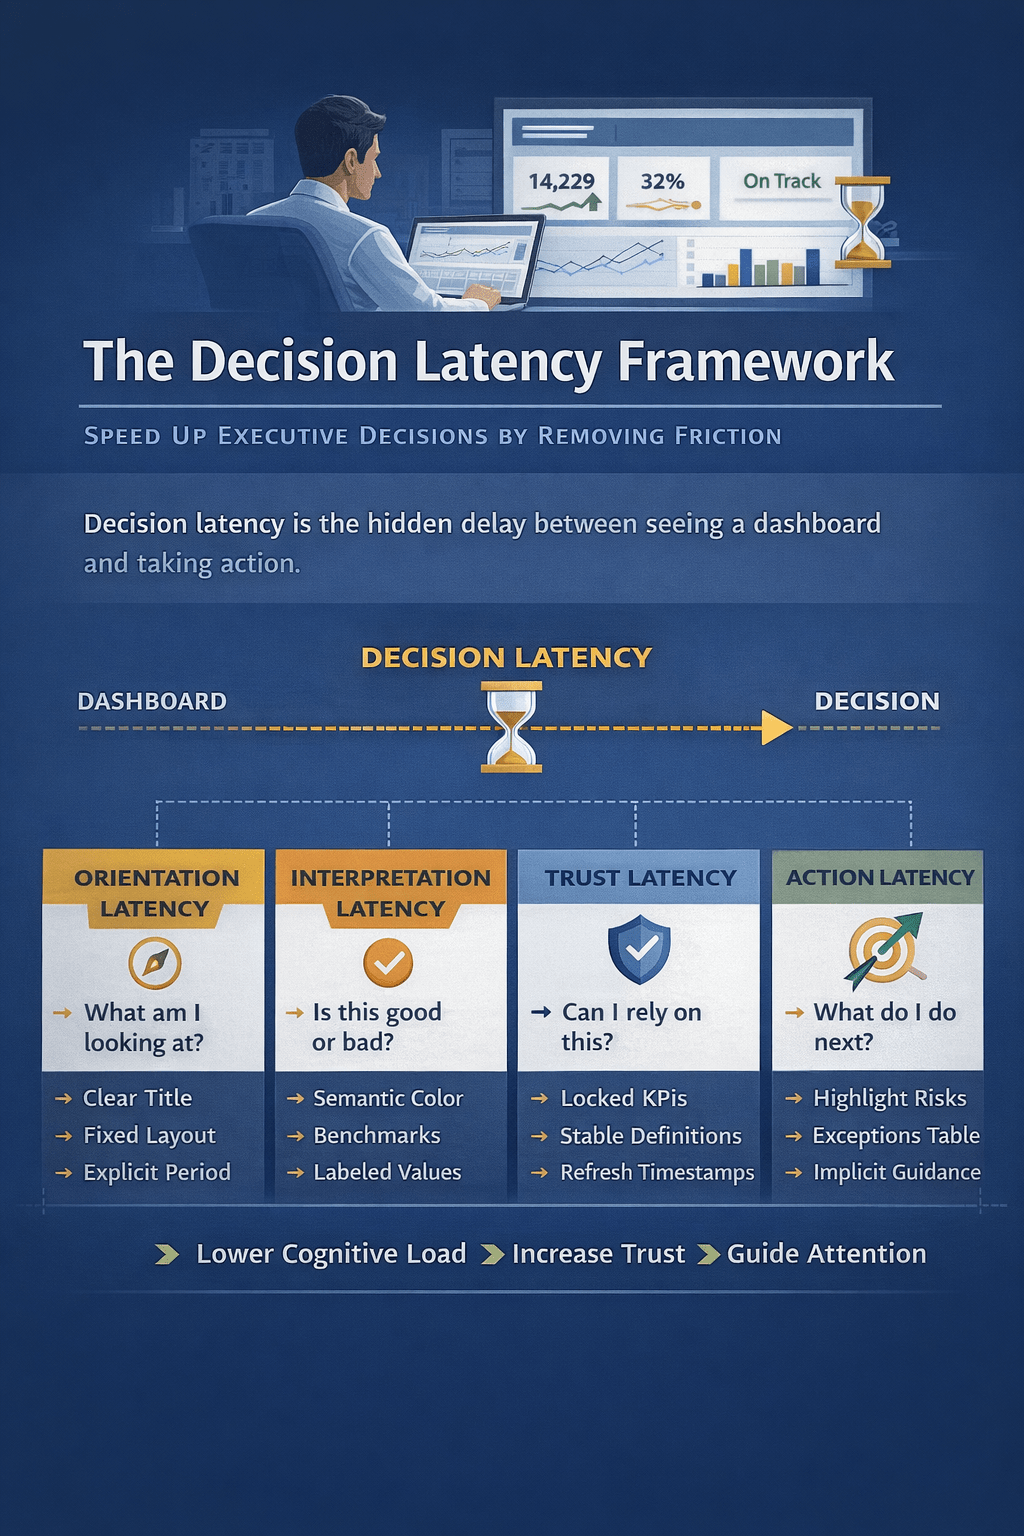
Dashboards excel at answering questions humans naturally ask when making decisions together:
- Where do we stand right now?
- Is performance improving or deteriorating?
- Which areas require attention?
- Are we aligned on what “success” means?
Most importantly, dashboards are social artifacts. They are reviewed in meetings, shared in reports, and referenced in conversations. Their value lies not only in the data they show, but in the shared mental model they create.
What Are Machine-Generated Insights?
Machine-generated insights are analytics outputs created automatically by algorithms rather than manually explored by users.
They typically include:
- anomaly detection (unexpected spikes or drops)
- automated variance explanations
- pattern recognition across large datasets
- predictive forecasts
- prescriptive recommendations
- natural-language summaries
- alerts and triggers
These insights are optimized for scale, speed, and coverage. Machines can scan thousands of metrics, dimensions, and time windows continuously—something no human team can do reliably.
Machine-generated insights are especially effective at answering questions like:
- What changed that we might have missed?
- Which patterns are statistically significant?
- What is likely to happen next?
- Which actions historically led to better outcomes?
However, they are often delivered outside traditional dashboard contexts: as notifications, text summaries, chatbot responses, or system-to-system signals.
Why the Tension Exists
The tension between dashboards and machine insights emerges because they optimize for different constraints.
Dashboards Optimize for Humans
- clarity over completeness
- stability over dynamism
- shared context over personalization
- visual pattern recognition
- explainability and trust
Machine Insights Optimize for Machines
- breadth over selectivity
- continuous monitoring
- probabilistic reasoning
- automation and scalability
- speed over deliberation
Problems arise when organizations lean too far in one direction.
The Risks of Over-Relying on Human-Readable Dashboards
Traditional dashboards, when used alone, struggle in modern data environments.
Common limitations include:
- Information overload: too many charts dilute attention.
- Slow discovery: users must manually explore to find issues.
- Reactive posture: dashboards often show problems after they occur.
- Hidden signals: subtle anomalies are easily missed.
- Analyst dependency: insights rely on manual interpretation.
In complex, fast-moving environments, dashboards alone can create blind spots.
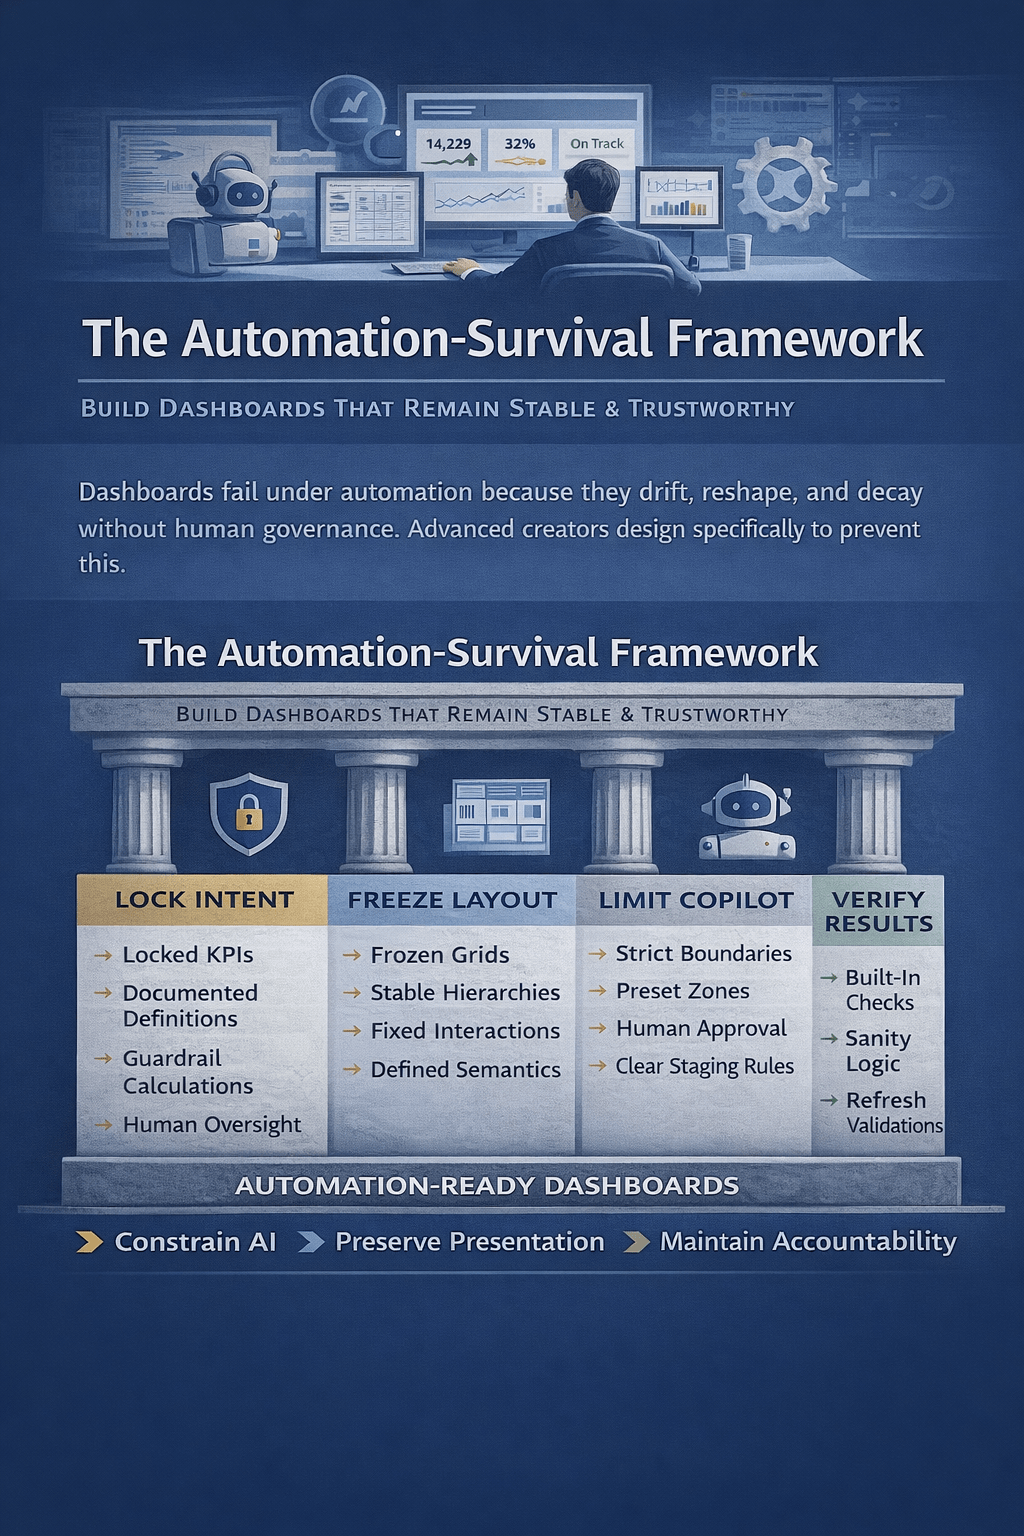
The Risks of Over-Relying on Machine-Generated Insights
At the opposite extreme, fully automated insights introduce different risks.
Key challenges include:
- Loss of shared context: personalized insights fragment understanding.
- Trust erosion: users may not understand or believe algorithmic conclusions.
- Overconfidence: probabilistic outputs can be mistaken for certainty.
- Metric drift: insights may be generated from poorly governed definitions.
- Audit and accountability gaps: “why did the system recommend this?” becomes difficult to answer.
When machine insights are detached from clear visual grounding, organizations risk replacing human judgment with opaque automation.
The Right Balance: Complementary Roles
The most effective analytics environments treat dashboards and machine insights as complementary layers, not competing paradigms.
A useful mental model is this:
- Dashboards define the truth
- Machines watch the truth
- Humans decide what to do about it
Dashboards as the Anchor
Dashboards should remain the authoritative reference for:
- core KPIs
- targets and benchmarks
- metric definitions
- historical context
- shared performance narratives
They answer: “What is the state of the business?”
Machine Insights as the Scout
Machine-generated insights should:
- monitor dashboards continuously
- surface deviations, risks, and opportunities
- explain changes humans notice
- highlight changes humans might miss
They answer: “What deserves attention right now?”
How the Two Work Best Together
1. Machine Insights Should Point Back to Dashboards
Every automated insight should be traceable to a visual context:
- a KPI card
- a chart
- a filtered view
- a time window
This creates a closed loop where users can verify, explore, and contextualize what the machine surfaced.
2. Dashboards Should Reserve Space for Machine Narratives
Modern dashboards increasingly include:
- “Key changes this period”
- “Top drivers of variance”
- “Anomalies detected”
- “Forecast vs target”
These summaries reduce cognitive load while preserving transparency.
3. Humans Should Retain Final Decision Authority
Even prescriptive insights should be framed as recommendations, not commands:
- include confidence levels
- show key assumptions
- allow override and annotation
- log decisions and outcomes
This maintains accountability and learning over time.
4. Governance Must Sit Above Both
Both dashboards and machine insights rely on:
- consistent data models
- clear KPI definitions
- documented transformations
- versioned logic
Without governance, automation simply accelerates confusion.
Practical Example: A Revenue Dashboard in Balance
Human-readable layer
- revenue vs target
- trend over time
- breakdown by region and product
- shared definitions of “revenue” and “pipeline”
Machine-generated layer
- alert: “Revenue missed forecast by 3.2%—primary driver: delayed enterprise deals”
- forecast: “65% probability of missing monthly target without intervention”
- recommendation: “Prioritize top 12 late-stage accounts in Region A”
The dashboard anchors the conversation. The machine insight accelerates focus. The human decides the response.
Design Principles for Balanced Analytics
To achieve the right balance, follow these principles:
- Design dashboards for people, not algorithms
- Design algorithms to serve dashboards, not replace them
- Make machine insights explainable and reversible
- Keep core metrics stable even as insights evolve
- Optimize for decision velocity, not just insight volume
The Bottom Line
Human-readable dashboards and machine-generated insights are not rivals. They are different cognitive tools solving different parts of the decision problem.
Dashboards provide structure, shared understanding, and trust.
Machine-generated insights provide speed, coverage, and foresight.
The future of analytics belongs to organizations that combine them thoughtfully—using machines to surface what matters, and dashboards to help humans understand, debate, and act on it together.