For years, Excel dashboards have relied on a familiar toolkit: structured tables, formulas, PivotTables, charts, slicers, and careful manual assembly. While powerful, this process has always required significant hands-on effort and technical expertise.
With the introduction of Excel Agent Mode in Copilot, Microsoft has taken a decisive step toward a new model of spreadsheet work—one where Excel can plan, execute, and build complex reporting structures on your behalf.
This article explains what Excel Agent Mode is, how it works, and what it means for building Excel dashboards going forward.

What Is Excel Agent Mode?
Excel Agent Mode is an advanced capability within Microsoft 365 Copilot that transforms Copilot from a passive assistant into an active, goal-driven agent.
Instead of responding to isolated commands like “write a formula” or “create a chart,” Agent Mode can:
- Understand a high-level objective
- Break it into multiple steps
- Execute those steps directly inside your workbook
In practical terms, this means Copilot can now build entire dashboard structures—including calculations, PivotTables, charts, and layouts—based on natural-language instructions.
Agent Mode is currently available in Excel for the web, with broader desktop availability expected as the feature matures.
How Agent Mode Differs from Traditional Copilot
To understand why Agent Mode matters, it helps to compare it with earlier Copilot functionality.
Traditional Excel Copilot
- Suggests formulas or insights
- Answers questions about data
- Requires users to assemble dashboards manually
- Works best for single, isolated tasks
Excel Agent Mode
- Plans multi-step workflows
- Modifies the workbook autonomously
- Creates new sheets, tables, and visuals
- Builds connected reporting structures
- Maintains native Excel functionality
Agent Mode effectively acts as a junior analyst embedded inside Excel, capable of executing an entire reporting workflow from start to finish.
Can You Build Excel Dashboards with Agent Mode?
Yes—and this is where Agent Mode becomes particularly transformative.
Using natural-language instructions, you can now ask Excel to:
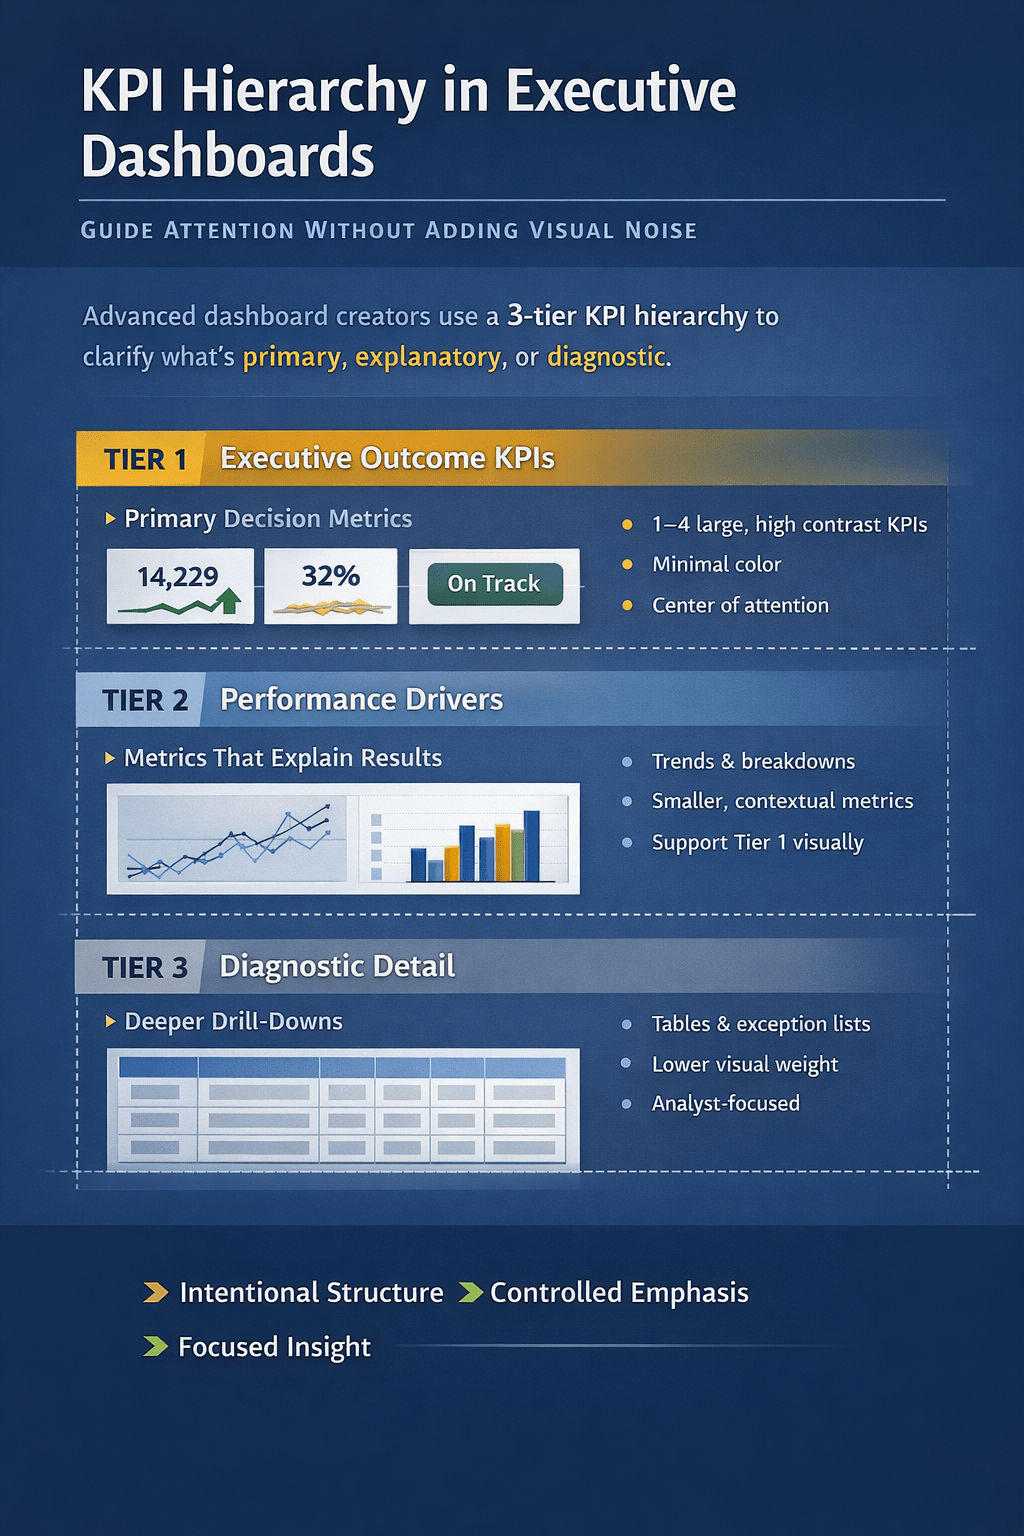
- Create KPI summary cards
- Build PivotTables from raw data
- Insert charts and trend visuals
- Add slicers and filters
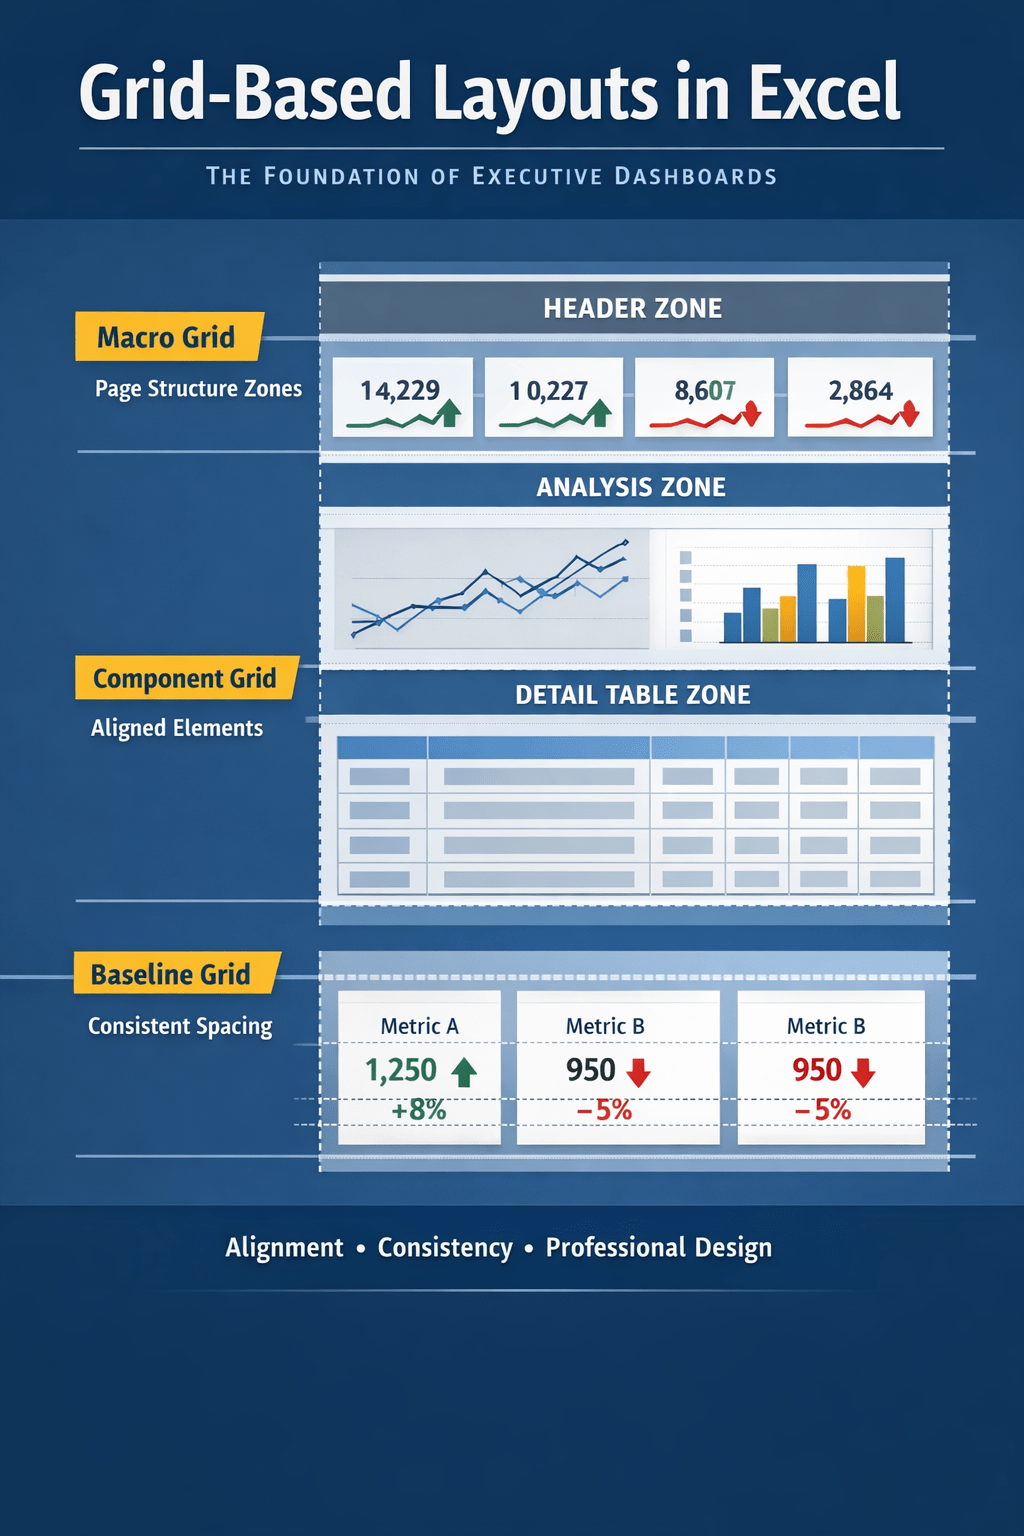
- Organize dashboard layouts across sheets
- Apply consistent formatting and labels
All outputs are native Excel objects, meaning they:
- Refresh automatically when data changes
- Remain editable by users
- Can be extended or customized manually
In other words, Agent Mode accelerates dashboard creation without replacing Excel’s core mechanics.
A Typical Agent-Mode Dashboard Workflow
Here is how a dashboard-building process typically looks when using Agent Mode.
1. Prepare Your Source Data
Agent Mode works best with:
- Clean, tabular data
- Clear column headers
- Proper data types (dates, numbers, categories)
- Data formatted as an Excel Table
This step remains essential—AI does not eliminate the need for good data structure.
2. Describe the Dashboard You Want
Instead of building components manually, you issue a high-level instruction such as:
“Create a financial performance dashboard showing total revenue, expenses, profit margin, and monthly trends. Include a PivotTable by department and a line chart for revenue over time.”
Agent Mode interprets this as a goal, not a single action.
3. Agent Planning and Execution
Behind the scenes, Agent Mode:
- Identifies relevant columns
- Determines necessary calculations
- Creates intermediate PivotTables
- Builds charts and KPI summaries
- Organizes them into logical sheets
This multi-step execution is what differentiates Agent Mode from traditional Copilot prompts.
4. Review, Refine, and Iterate
You remain in full control. You can:
- Adjust formulas or visuals manually
- Ask follow-up instructions like “add a slicer for year” or “separate actual vs budget”
- Request layout changes or formatting updates
Agent Mode supports iterative refinement, making dashboard design faster and more conversational.
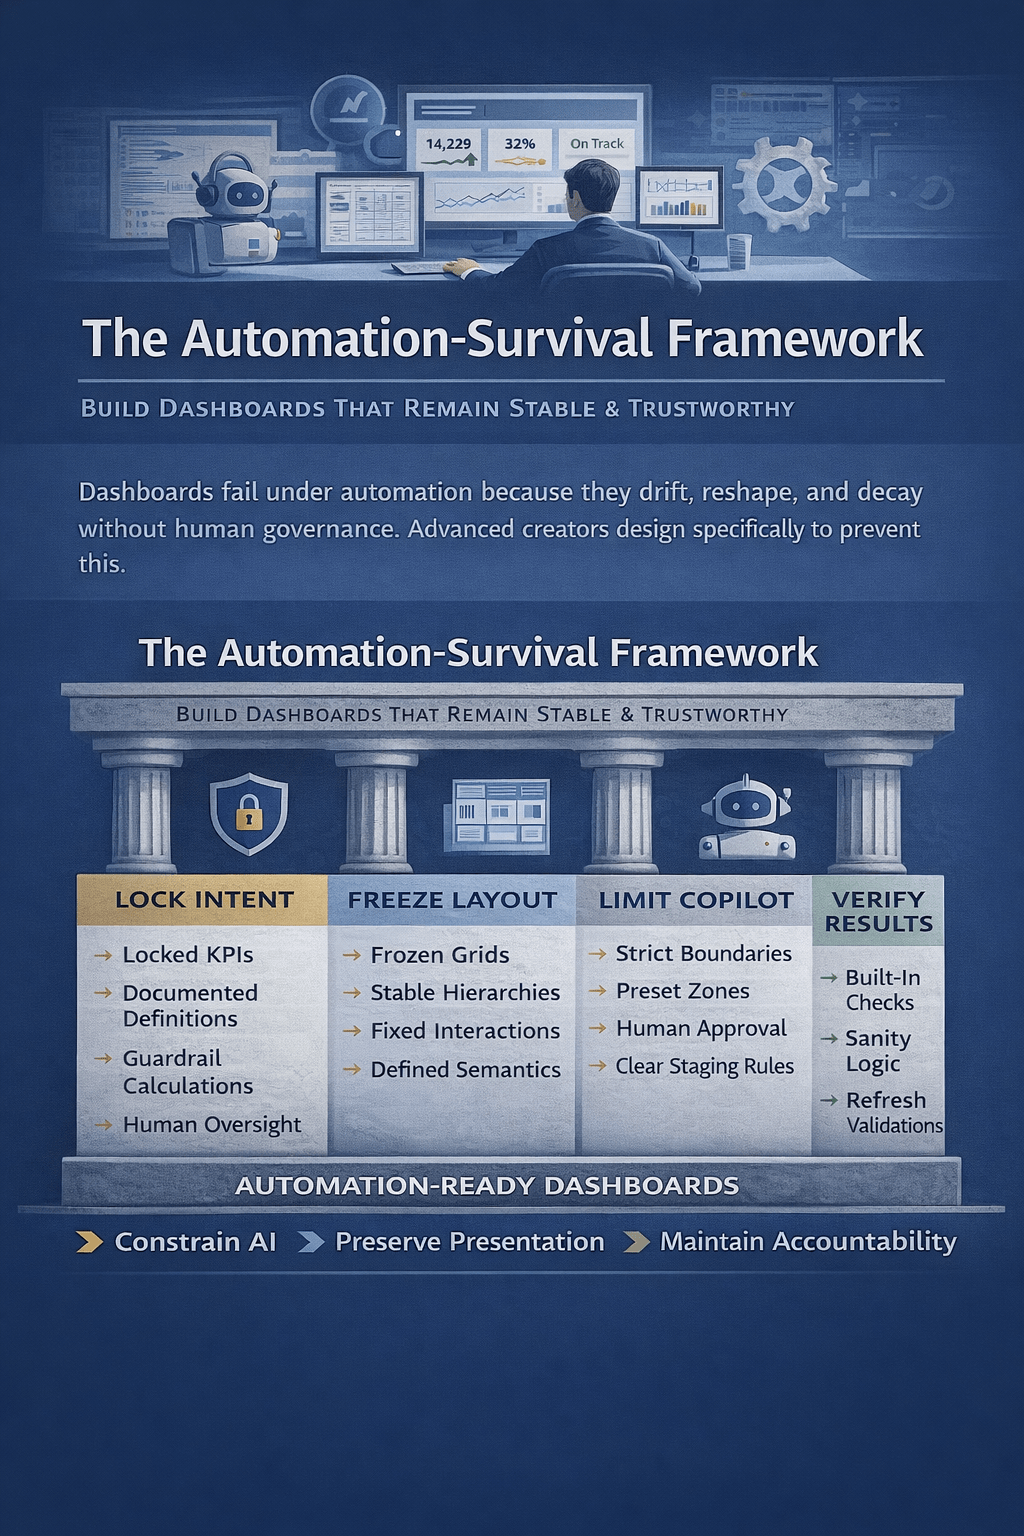
What Agent Mode Does Not Replace
Despite its power, Excel Agent Mode does not eliminate the need for human judgment.
You still need to:
- Define meaningful KPIs
- Validate calculations
- Understand business context
- Ensure dashboards tell the right story
- Apply governance and data controls
Agent Mode accelerates execution—but humans still define intent, interpretation, and accountability.
Implications for Excel Dashboard Design
Agent Mode changes how dashboards are built, but not what makes them effective.
Key implications include:
Faster Prototyping
Dashboards that once took hours can now be scaffolded in minutes.
Lower Skill Barrier
Non-experts can create advanced dashboards without deep Excel knowledge.
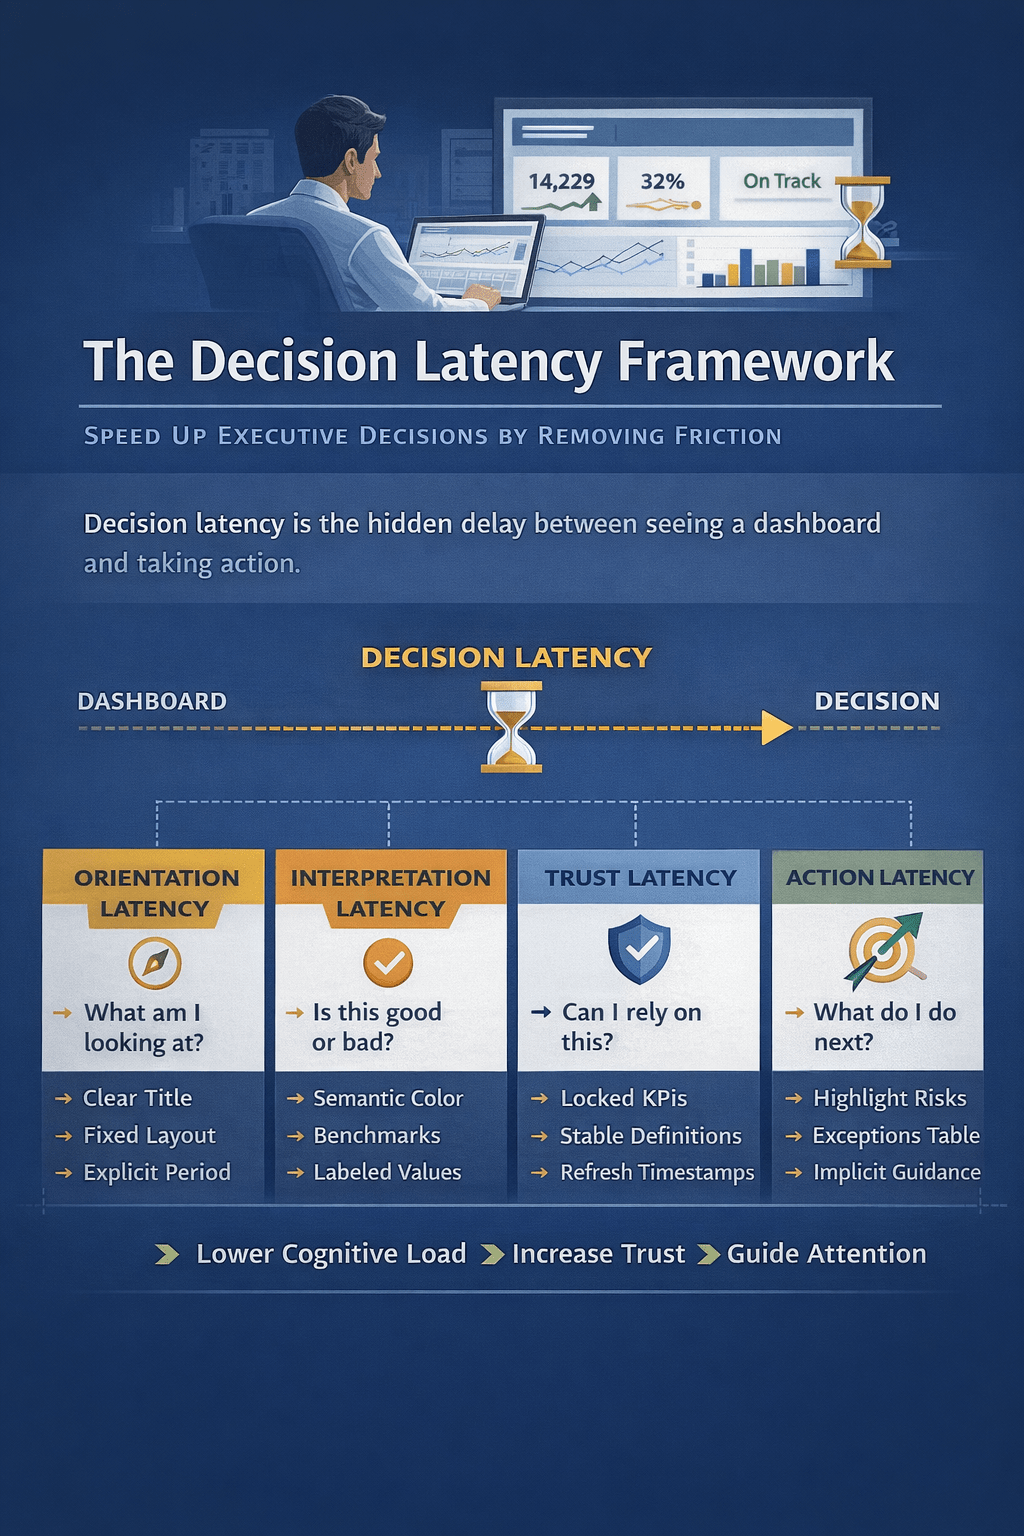
Higher Focus on Insight
Less time is spent on mechanics, more time on interpretation and decision-making.
Continued Relevance of Excel
Rather than replacing Excel dashboards, Agent Mode strengthens Excel’s position in an AI-augmented analytics world.
Excel Agent Mode vs. BI Tools Like Power BI
Agent Mode does not turn Excel into Power BI—but it narrows the gap.
| Aspect | Excel Agent Mode | Power BI |
|---|---|---|
| Data modeling | Light | Advanced |
| Dashboard speed | Very fast | Moderate |
| Learning curve | Low | Higher |
| Governance | Limited | Strong |
| Enterprise scale | Moderate | High |
For many teams, Agent Mode makes Excel dashboards good enough—and much faster to build.
What This Means for the Future of Dashboards
Excel Agent Mode signals a broader shift:
- Dashboards are no longer handcrafted artifacts
- They are AI-assisted constructions
- Built through intent, not manual assembly
- Maintained through conversation, not constant rework
Dashboards are not disappearing—but they are becoming co-created with AI.
Final Thoughts
Excel Agent Mode represents one of the most significant evolutions in spreadsheet workflows in decades.
It does not replace dashboards.
It does not replace analysts.
It does not replace Excel skills.
What it does replace is friction.
By turning high-level intent into executable action, Agent Mode allows Excel users to focus less on how dashboards are built—and more on why they matter.
For anyone building dashboards, reports, or operational views in Excel, Agent Mode is not just a feature—it is a fundamental shift in how Excel work gets done.