As Power BI continues to gain traction across enterprises, many analysts suggest that Excel dashboards are becoming outdated. Yet inside most organizations, Excel remains the primary tool for daily reporting, quick KPI checks, and operational dashboards. Why?
Because Excel solves a very different category of problems—problems that require speed, flexibility, detail, and control. While Power BI is optimized for enterprise-scale reporting, Excel remains the irreplaceable engine for hands-on analysis and everyday decision-making.
This article explains why Excel continues to dominate daily dashboard workflows, even as Power BI adoption accelerates globally.

Excel’s Core Strength: Flexibility at the Speed of Business
Power BI delivers automation and consistency, but Excel delivers agility. And for daily business operations, agility almost always wins.
1. Instant Answers Without a Pipeline
In Excel, data is immediately available for transformation, calculations, and visualization.
There is no publishing step, no refresh scheduling, and no data-model preparation.
You simply work.
For analysts, Excel offers the fastest path from raw numbers to insight.
2. Pivot Tables and Formulas Enable Rapid Exploration
Excel is built for hands-on analysis. Users can test ideas, slice data, build temporary KPIs, and try “what-if” scenarios with zero setup.
This makes Excel the preferred tool for:
- performance reviews
- quick weekly tracking
- variance explanations
- ad-hoc investigations
- exploratory insights
Power BI simply cannot match this level of on-demand manipulation.
3. Excel Works for Small Teams and Localized Data
Most business decisions are made by small groups using departmental data—not enterprise-wide datasets.
Excel shines here because it:
- lives on a local machine
- requires no special infrastructure
- can be modified by anyone with basic Excel skills
This is why countless dashboards still live inside Excel workbooks—and why they are trusted.
Excel as the Foundation of Financial and Operational Logic
Beyond speed, Excel remains the backbone of financial modeling and operational workflows.
1. Finance Runs on Excel
Budgets, forecasts, cashflows, scenario models—these processes are all built in Excel.
Power BI can visualize results, but it cannot replace the modeling engine.
2. KPI Logic Is Easier to Control
Many dashboards require nuanced formula logic such as:
- nested IFs
- rolling averages
- custom variance logic
- period-to-date calculations
These are simply easier to adjust in Excel than in DAX.
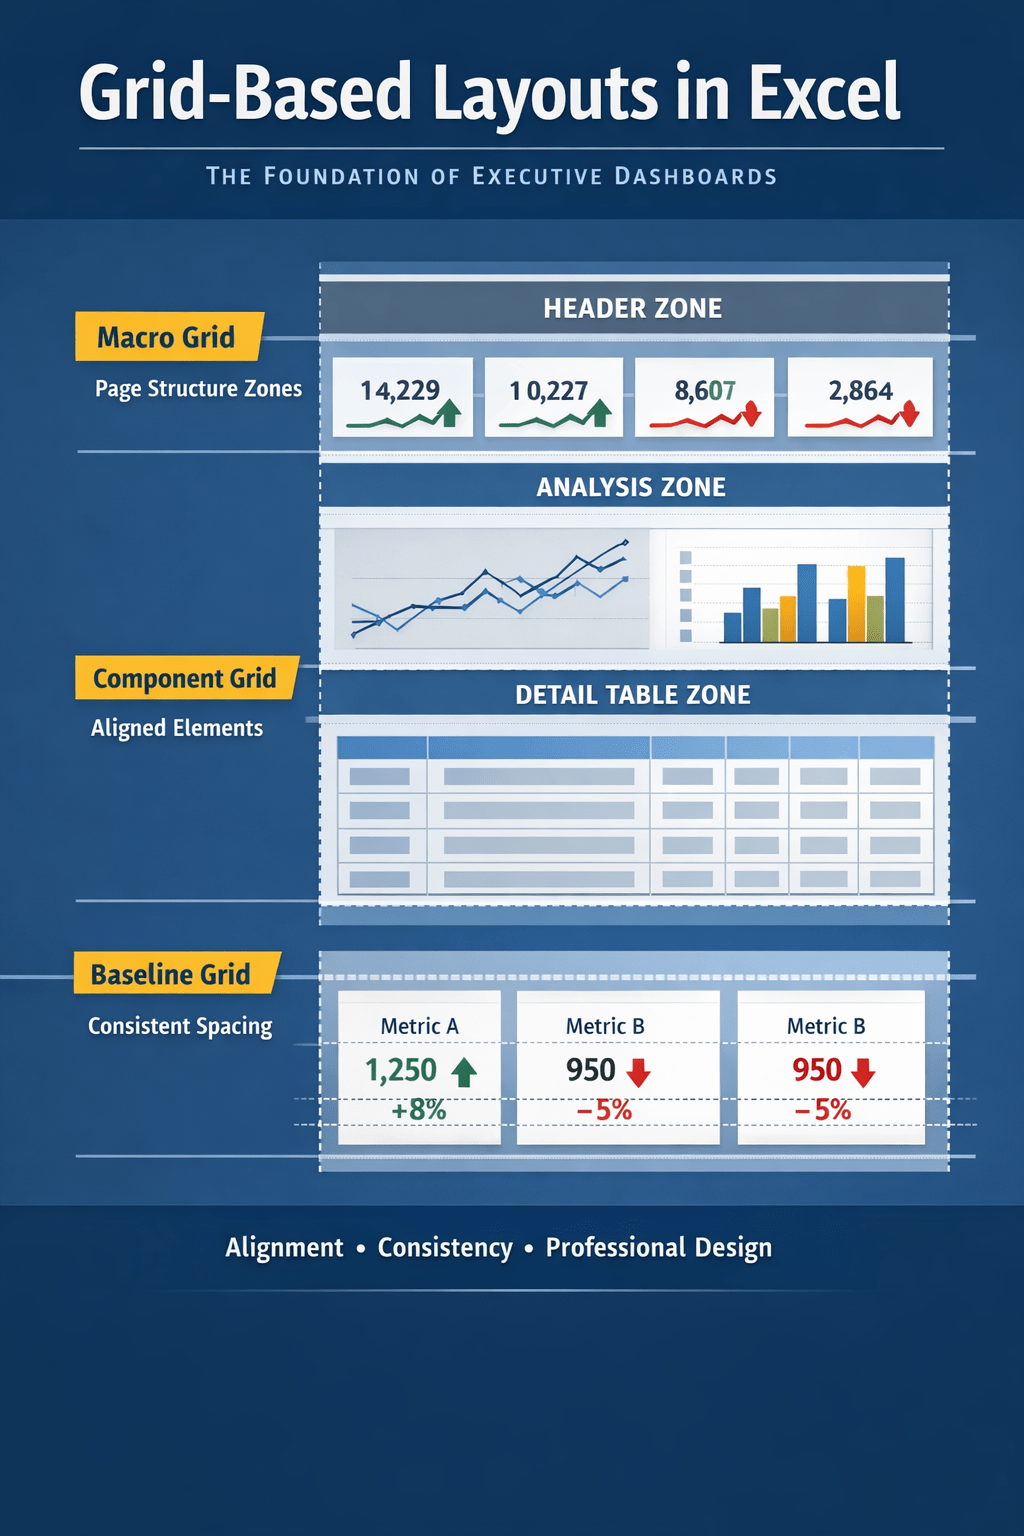
3. Excel Dashboards Are Highly Customizable
Mini dashboards built in Excel offer:
- sparklines
- conditional formatting
- KPI cards
- grid-based alignment
- clean modular layouts
This level of pixel-level control is often essential for daily reporting.
Power BI’s Role: Enterprise Distribution, Not Daily Work
Despite Excel’s strengths, Power BI excels in environments where:
- dashboards must be shared broadly
- data must refresh automatically
- governance and security are required
- drill-down functionality matters
Because of this, the modern reporting ecosystem looks like:
Excel = daily insights, calculations, analysis
Power BI = enterprise dashboards, automation, distribution
Excel remains dominant because daily business decisions happen inside Excel—not inside centralized BI dashboards.
Why Excel Mini Dashboards Continue to Grow in Popularity
Excel mini dashboards are ideal for:
- team performance scorecards
- budget vs actual views
- weekly operational tracking
- project health reporting
- quick KPI storytelling
Their advantages:
- can be built in under 30 minutes
- require no IT involvement
- can be emailed or shared instantly
- are perfect for small datasets
- integrate seamlessly with existing Excel workflows
Power BI dashboards take longer to build and maintain, making Excel the preferred medium for time-sensitive updates.
Conclusion
Power BI adoption is unquestionably rising—but Excel remains unmatched for day-to-day dashboarding. Its speed, flexibility, familiarity, and modeling power keep it at the center of business operations.
Enterprises will continue adopting Power BI for large-scale reporting, but Excel will remain the analytical engine that drives daily decision-making. In most organizations, the future is not “Power BI vs Excel,” but a practical combination of both.
Excel for agility.
Power BI for scale.
And that balance is exactly why Excel dashboards continue to thrive.